The website will be offline from Wednesday the 22nd of July 2026 at 8:00 AM to Wednesday the 22nd of July 2026 at 12:00 PM. We apologize for any inconvenience this may cause.
Frequently Asked Questions (FAQ)
What is the MTBS program?
MTBS is an interagency program to map the location, extent and associated burn severity of all large fires (including wildfire, wildland fire use and prescribed fire) in the United States across all ownerships from 1984 to present.
Why was the MTBS project implemented?
In 2004, the WFLC adopted a strategy to monitor the effectiveness and effects of the NFP and the HFRA initiated in 2000 and 2002, respectively. The monitoring strategy identified a need to assess the environmental impacts of large wildland fires and identify trends in burn severity on all lands across the United States and synoptically assess environmental impacts and trends. The MTBS Program was implemented to generate the geospatial data to address this information need. Additionally, the MTBS program directly meets the recommendations outlined by the 2004 GAO report (GAO-04-705) specifying the need for providing geospatial fire and burn severity characterization data at regional and sub-regional scales to support resource and risk assessments, resource management, monitoring, and research activities.
What is the WFLC?
WFLC is an intergovernmental committee to support the implementation and coordination of Federal Fire Management Policy. WFLC is the original sponsor of the MTBS program.
Who is responsible for producing MTBS geospatial data and products?
MTBS is jointly implemented by the USGS EROS and the United States Department of Agriculture, Forest Service GTAC. MTBS data processing, analysis and fire mapping activities are conducted by the two centers. Representatives from the Forest Service, Department of Interior agencies, academia and non-governmental organizations provide technical consultation and support.
Who funds the MTBS Program?
Funding for the MTBS Program is provided by the Forest Service and Department of Interior agencies.
How is MTBS related to LANDFIRE?
The LANDFIRE Program routinely updates their existing vegetation and fuel layers to reflect landscape changes that had occurred since previous remap and refresh efforts (see LANDFIRE Disturbance web page). MTBS and other post-fire mapping data provided by the U.S. Department of Agriculture, Forest Service and USGS provide a comprehensive and consistent source of fire disturbance and characterization data. This data is used by LANDFIRE to update specific layers to reflect current conditions.
What is the difference between MTBS and other post-fire mapping programs?
MTBS is the largest and most spatially and temporarily comprehensive post-fire mapping and assessment program conducted by the United States Department of Agriculture Forest Service and the USGS. Additional post-fire mapping and assessment programs are also conducted and focus on particular information needs of particular federal programs, staff areas and user communities. Gateways to more information about these programs and to access available data are available on the Burn Severity Portal.
Why does the MTBS data record begin in 1984?
MTBS primarily uses Landsat which provides continuity in multispectral data from the Landsat TM sensor onboard Landsat 4 and 5, the Landsat ETM+ onboard Landsat 7, followed by the Landsat OLI onboard Landsat 8 and 9. This continuity provided by TM/ETM+/OLI satellite data ensures consistency in the mapping and characterizing fires extending back to 1984 shortly after the first TM sensor was launched on Landsat 4 in 1982.
The Sentinel-2 MSI is also leveraged by the MTBS Program. MSI imagery from Sentinel-2A, launched in mid-2015, and Sentinel-2B, launched in early 2017, are used to provide additional observation opportunities to map fires when quality Landsat imagery is not available.
Is there a publication that describes how MTBS data are compiled/processed?
Yes. Please see the 2007 publication entitled "A Project for Monitoring Trends in Burn Severity". The MTBS Program is currently preparing a document describing its mapping protocols which is anticipated to be published on the MTBS website in the future.
If you have a question which has not been addressed on the FAQs page, please contact us. Your question will be forwarded to the MTBS project and you will receive an answer. If appropriate, your question will be added to the MTBS FAQs web page.
What is burn severity?
In the MTBS project, "burn severity" refers specifically to fire effects on above-ground biomass. The definition is drawn from the reference: NWCG Glossary of Wildland Fire Terms and is based on the term Fire Severity, which is defined as: "Degree to which a site has been altered or disrupted by fire; loosely, a product of fire intensity and residence time."
The following additional statements further clarify the nature of the products developed by this project:
- Burn severity is a composite of first-order effects and second order effects that arise within one growing season.
- Burn severity relates principally to conditions detectable by remote sensing methods, including changes to living and non-living biomass, fire byproducts (scorch, char, ash), and soil exposure.
- Burn severity occurs on a gradient or ordinal scale.
- Burn severity is a mosaic of effects that occur within a fire perimeter.
- Longer term effects are controlled by variables that evolve after a fire and are beyond the scope of this program.
- Burn severity is mappable and remotely sensed data provide a measurement framework.
What is NBR?
NBR is a normalized index that emphasizes the spectral response of fire-affected vegetation by leveraging near infrared and short-wave infrared bands in satellite imagery to provide the best contrast between photosynthetically healthy and burned vegetation or bare soil, rock, etc.
How should burn severity be interpreted in reburned areas which previously experienced high burn severity?
Areas previously burned as high severity in recent years, which then reburn during a subsequent fire, may be mapped with burn severity levels which do not capture the total change resulting from both fires, nor correspond well to ecological integrity for various reasons. MTBS and most other burn severity programs primarily utilize remote sensing imagery to detect change to vegetation conditions immediately before the fire, and either immediately or the first growing season after the fire. This means that burn severity mapping will inherently be aligned with recent green vegetation change based on the timing of the pre-fire and post-fire images used in the assessment. In previously high severity reburns, where there is no green canopy remaining, a flush of herbaceous growth after fire can result in classification as low severity in the burn severity mapping product even though the area may have low ecological resilience and may not be within the historic natural range of variation for that site. For example, a previously forested site that is at least temporarily type-converted after high severity fire to shrub or herbaceous vegetation may not have the most beneficial species and ecological function but may be mapped as low severity due to a high relative post-fire greenness. Users will want to utilize local knowledge and additional datasets to answer management questions more targeted at ecological condition rather than change detection, particularly in previously high severity reburns
What fires are mapped by the MTBS program?
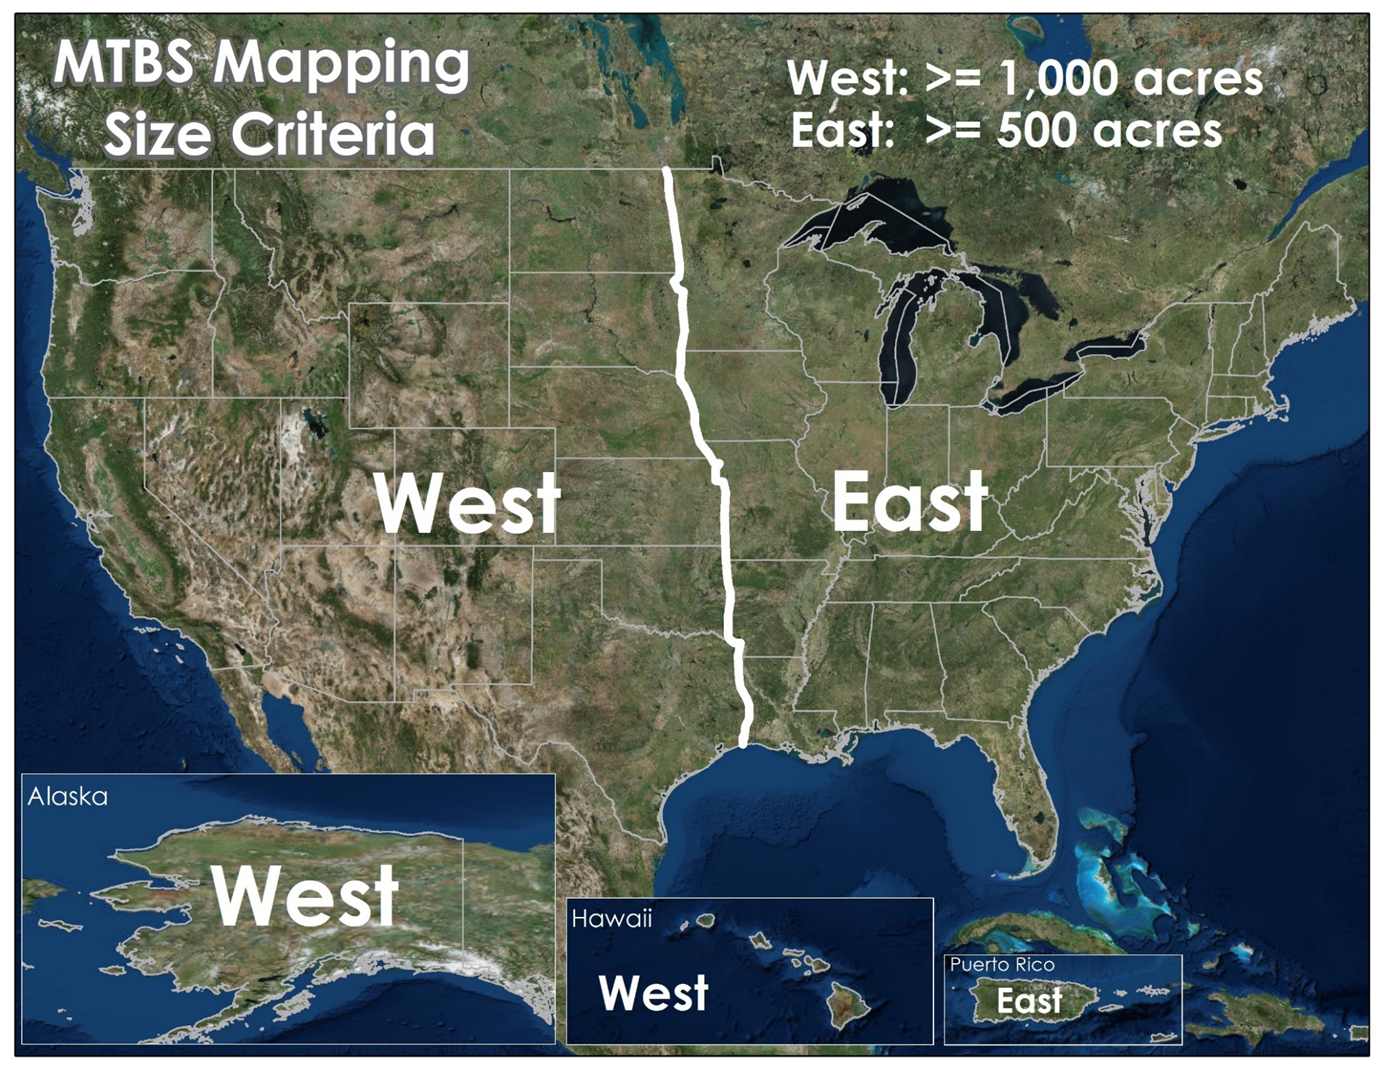
MTBS inventories and maps all known large fires within the United States, regardless of fire origin or type. Fires within the continental United States as well as Alaska, Hawaii and Puerto Rico are included. Large fires include those in the western United States that are at least 1,000 acres in size and those within the eastern United States that are at least 500 acres in size. Alaska and Hawaii are in the western zone, Puerto Rico is in the eastern zone (see the map below). Known fires are those that are documented in fire occurrence databases ingested by the program (see the following FAQ below for more information). Additionally, undocumented fires that are identified by mapping analysts during the analysis process are also inventoried and mapped if they meet the MTBS program's size and location requirement.
How does MTBS know where the fires are located for mapping?
MTBS primarily utilizes IRWIN and NFPORS to identify the occurrence of wildland and prescribed fire activity for the current year and recent past years. These fire reporting applications include fire occurrence data harvested from source systems of record provided by state and federal agencies/organizations. Fire occurrence data with reasonably precise geospatial descriptions (latitude/longitude) are compiled and standardized to generate a point location dataset. Core database elements are compiled as a part of this dataset and include, but are not limited to, the fire incident ID and name, fire type, reported fire size, date of fire ignition, date of fire containment, date of fire declared out. The MTBS program uses this dataset to support all phases of the fire mapping process (i.e., to determine the appropriate assessment strategy, selection of appropriate satellite image data, association of the fire information with the appropriate burn area identified using remote sensing data, etc.). In seeking additional information about an incident(s) that is not reported by MTBS, please use fire reporting data from the IRWIN and NFPORS websites.
Why are some fires missing from the MTBS database?
A fire may be missing from the MTBS database for the following reasons:
- The size of the fire was misreported. A 5,000 acre fire may be missed if it is reported as 50 acres.
- Inaccurate reporting of date of ignition, containment, or location may lead to a fire not being assessed at the proper time and location, thus making it unlocatable.
- Poor image quality. Near cloud-free observations of both pre-fire and post-fire imagery are required in order to produce an accurate mapping.
- Fires of very low severity may not be visible in the imagery and thus not possible to delineate or characterize.
- The fire was not present in the wildfire and prescribed fire occurrence data collected from state and federal agencies/organizations
How were the particular MTBS fire size thresholds determined?
The focus of MTBS is to assess the environmental impacts of large wildland fires and identify the trends of burn severity on all lands across the United States. This does not require a census of all wildland fires that have occurred, nor is that feasible due to the resource constraints and technical limitations. During the planning stages of the MTBS program, an analysis of historical wildland fire occurrence data determined that targeting fires >= 500 acres in the eastern United States and >= 1000 acres in the western United States captures approximately 95% of the annual area burned. These size specifications provide MTBS the ability to meet the monitoring requirements specified in the original scope of the program within a reasonable cost and timeframe
What is a revised fire?
A "revised" fire is a modified version of the originally released geospatial data and mapping products for a mapped MTBS fire. Typical reasons for updating a fire may include the availability of higher quality imagery, edits to the burned area boundary or updates to the severity thresholds. When a revision of a fire is conducted, the geospatial data and mapping products are recompiled and republished. The originally published MTBS dataset is removed from the data distribution archive.
What do Initial Assessment and Extended Assessment mean?
Each fire that is mapped by MTBS has either an "Initial" or "Extended" assessment strategy. An Initial Assessment relies on post-fire satellite data typically acquired at the first opportunity after the fire in order to capitalize on the maximum post-fire data signal and is used primarily in ecosystems that exhibit rapid post-fire vegetation response (i.e. grass, herbaceous and particular shrubland systems). An Extended Assessment relies on post-fire satellite data typically acquired at the peak of the growing season following a fire in order to include any delayed first order fire effects (e.g. initial site response and early secondary effects).
What are the definitions of the fire types in MTBS data?
- Wildfire - An unplanned, unwanted wildland fire including unauthorized human-caused fires, escaped wildland fire use events, escaped prescribed fire projects, and all other wildland fires where the objective is to put the fire out (definition currently under NWCG review).
- Prescribed Fire - Any fire intentionally ignited by management actions in accordance with applicable laws, policies, and regulations to meet specific objectives.
- Wildland Fire Use - An event dealing with the management of a naturally ignited wildland fire to accomplish specific prestated resource management objectives in predefined geographic areas outlined in the Fire Management Plans. The 2009 Guidance for Implementation of Federal Wildland Fire Management Policy recognized only two types of wildland fires: Wildfires (unplanned ignitions) and Prescribed Fires (planned ignitions). Following this guidance, the term Wildland Fire Use is no longer used to categorize fires after 2009.
- Unknown - A fire event whose incident type was not reported from the original reporting agency.
- Complex - Two or more individual incidents located in the same general area which are assigned to a single incident commander or unified command.
- Out of Area Response - Multiple resource response to a wildfire incident. This term applies exclusively to wildfire incidents.
Are MTBS mappings revised?
Yes. If a need to revise a previously released MTBS dataset is necessary, the geospatial data and mapping products are recompiled accordingly and then republished. The original MTBS dataset is removed from data distribution and replaced with the updated dataset. For this reason, we suggest that each time a user begins a project using MTBS data, they download and use the latest datasets available from the MTBS website. See also, "I have found an MTBS dataset that has a problem. What do I do?" under the Geospatial Data tab of FAQs.
How often is new MTBS data released?
The MTBS Program currently releases new geospatial fire data approximately each quarter. All data completed since the previous release is provided, regardless of fire year. Consequently, individual data releases may include fires from multiple years. Please see Data Availability for more information on the MTBS data release schedule. Users can monitor for new data releases on the "Announcements" webpage on the MTBS website.
What is the citation for MTBS data and reporting products?
| Citation Target | Reference | Example |
|---|---|---|
| General information from MTBS project website | Webpage Title. (revision date). MTBS Project Homepage. Available online: URL [Access Date]. | Monitoring Trends in Burn Severity. (2017, July - last revised). [MTBS Project Homepage, USDA Forest Service/U.S. Geological Survey]. Available online: https://www.mtbs.gov[2017, July12]. |
| MTBS geospatial datasets | Webpage Title: Data product. (revision date). Agencies. Available online: URL [Access Date]. | MTBS Data Access: Fire Level Geospatial Data. (2017, July - last revised). MTBS Project (USDA Forest Service/U.S. Geological Survey). Available online: Burn Severity Direct Download [2017, July12]. |
| MTBS project reports | Report compiler. Publication date. Report title. Available online: URL. | Schwind, B. (compiler). 2008. Monitoring Trends in Burn Severity: Report on the PNW & PSW Fires—1984 to 2005. Available online: https://www.mtbs.gov/. |
| Other MTBS Program products | Webpage Title: Product MTBS Program Homepage, [Online]. Available: URL [Access Date] | Monitoring Trends in Burn Severity, Understanding and Using MTBS Data. [MTBS Program Homepage, US Department of Agriculture, Forest Service/U.S. Geological Survey],[Online]. Available: http://www.mtbs.gov/training-outreach [2023, September 6]. |
What datasets are compiled by MTBS for each fire?
The following geospatial datasets and mapping products are produced for every MTBS fire. File format is noted in parentheses.
- Pre-fire Landsat/Sentinel-2 30m reflectance image subset (GeoTiff)
- Post-fire Landsat/Sentinel-2 30m reflectance image subset (GeoTiff)
- 30m dNBR or NBR image subset (GeoTiff)
- 30m RdNBR image subset (GeoTiff) - only available if dNBR is available
- 30m 6-class thematic burn severity (GeoTiff)
- Burned area perimeter (shapefile)
- Non-processing area mask (shapefile)
- FGDC metadata (text/XML)
- Letter-sized, post-fire Landsat image and burn severity map with burn severity statistical summary (PDF)
- Google Earth map with pre/post Landsat image, burn scar boundary and thematic burn severity data (KMZ)
Does the MTBS project provide mosaicked geospatial products?
Yes. Currently, two MTBS datasets are provided as seamless national data products. MTBS burn area boundary polygons and fire occurrence points are each provided as a single nationwide datasets that includes the continental United States, Alaska, Hawaii and Puerto Rico. These national datasets can be downloaded from the Burn Severity Direct Download web page. Fire level thematic burn severity data are also mosaicked to generate annual, seamless burn severity raster layers created for each state as well as continental United States. These annual states and CONUS thematic burn severity mosaics can also be downloaded from the Burn Severity Direct Download web page.
What is the spatial resolution/scale of MTBS data?
MTBS raster datasets are generated primarily from Landsat (TM/TM/OLI) image data which is acquired at a spatial resolution of 30 meters. Where quality Landsat observations are not available, Sentinel-2 (MSI) image data - available since late 2015 - are used to compile MTBS raster datasets. Sentinel-2 multispectral data are acquired at a spatial resolution of 10 meters or 20 meters and resampled to 30 meters to create spatially consistent MTBS end products. MTBS vector datasets (burn scar boundaries) are delineated from imagery and burn severity index data at a map scale of 1:24,000 to 1:50,000.
What is the projection/coordinate system of MTBS data?
All MTBS data are provided in Albers Equal Area projection using the regional projection parameters specified below for the continental United States, Alaska, Hawaii and Puerto Rico. User note: the positional accuracy difference between NAD83 and WGS84 is negligible given the resolution/scale of MTBS data.
| Projection Parameter | CONUS | Alaska | Hawaii | Puerto Rico |
|---|---|---|---|---|
| Projection | Albers Equal Area | Albers Equal Area | Albers Equal Area | Albers Equal Area |
| Spheroid | GRS 1980 | WGS 84 | WGS 84 | GRS 1980 |
| Datum | NAD83 | WGS 84 | WGS 84 | NAD83 |
| Latitude of 1st standard parallel | 29:30:00 N | 55:00:00 N | 8:00:00 N | 8:00:00 N |
| Latitude of 2nd standard parallel | 45:30:00 N | 65:00:00 N | 18:00:00 N | 18:00:00 N |
| Longitude of central meridian | 96:00:00 W | 154:00:00 W | 157:00:00 W | 66:30:00 W |
| Latitude of origin of projection | 23:00:00 N | 50:00:00 N | 3:00:00 N | 3:00:00 N |
| False easting of central meridian | 0 meters | 0 meters | 0 meters | 0 meters |
| False northing at origin | 0 meters | 0 meters | 0 meters | 0 meters |
Why does MTBS use Albers Equal Area projection for its data?
Mapping and image-derived geospatial data for regional and continental scale areas of large east-west extent are typically compiled in an equal area projection. The Albers Equal Area projection is routinely used for data that covers the continental United States or outside the continental United States regions, including Alaska, Hawaii, and Puerto Rico.
MTBS uses unique Albers Equal Area projection parameters that are published for each of these geographic regions. Data practitioners may reproject data and change the projection parameters in the process to address project needs (i.e., minimize distortion for an area of interest, maintain positive map coordinate values, etc.). Other related national mapping programs that provide data at similar spatial resolution and extent as MTBS, such as LANDFIRE and the NLCDMTBS, LANDFIRE, and NLCD all deliver their data using the same Albers Equal Area projection parameters. This enables users to conveniently integrate these data for visualization and analysis.
To provide flexibility and better meet the needs of end users, the MTBS Program is taking steps to develop and implement new data management and dissemination technologies. As of March 2026, users now have the option to download fire products in local UTM projection.
How does MTBS determine the thematic burn severity classes?
Thresholding continuous burn severity index data into thematic burn severity classes is a considerable technical procedure and varies slightly between fires in different ecological settings. A technical description of the thresholding process is provided on the Mapping Methods page and in the paper "A Project for Monitoring Trends in Burn Severity."
What are the MTBS thematic burn severity data class descriptions?
MTBS thematic burn severity products (dNBR6 and NBR6 datasets in fire level geospatial data products, state and national burn severity mosaics, and thematic burn severity layers in web map services) are classified according to the burn severity class definitions provided below. The numeric value/code is also noted at the beginning of the definition for each class.
- Background/No Data - (Value/code = 0) Areas outside of the burned area boundary and excluded from the MTBS mapping process.
- Increased Greenness - (Value/code = 5) Areas that burned but display more vegetation cover, density, and/or productivity (vigor), usually within one growing season after fire. This is a fire-caused effect from release of nutrients into soil, and/or reduced competition for nutrients, light and water (much like a thinning effect). These areas are usually herbaceous or low shrub communities that undergo little change in species composition after fire.
- Unburned to Low - (Value/code = 1) Areas that are either unburned, or when visible fire effects occupy a small proportion of the site, on the order of less than 5 percent. If more of the site is burned, then effects are limited to a few biophysical components. The class may also include areas that recover very quickly after fire, such as grasslands or light surface burns under dense, non-impacted forest canopies.
- Low - (Value/code = 2) Areas where more than a small proportion of the site burned. Collectively, all strata are slightly altered from the pre-fire state. Duff, woody debris and newly exposed mineral soil typically exhibit some change. Low vegetation (<1 meter) and shrubs or trees (1-5 meters) may show significant aboveground scorch, char or consumption, and vegetation density or cover may be greatly altered. These prefire plants are generally still viable and recover quickly (within a year or two), with little change in species composition. An exception is western conifers, where sapling-sized trees may exhibit 50 percent or more mortality. Intermediate and large overstory trees may exhibit up to 25 percent mortality evidenced by crown char or scorch. Where charring does not kill tree crowns, as is common in the southeast, higher percentages of black char may occur. Char height from ground flames is typically less than 3 meters.
- Moderate - (Value/code = 3) The moderate class is difficult if not impossible to briefly describe. Indicators may be fairly consistent across biophysical strata and will exhibit traits between the low and high severity classes. On the other hand, numerous potential combinations of distinct low and high indicators may occur to yield a moderate classification overall within the minimum mapping unit. Conditions are transitional in magnitude and/or uniformity between the low and high characteristics described.
- High - (Value/code = 4) This class is characterized by fairly consistent effects across a site. In forested ecosystems, litter is totally consumed; duff is typically nearly entirely consumed. Medium and heavy woody debris are at least partially consumed and at least deeply charred with mostly ash and charcoal remaining. Overstory trees typically exhibit greater than 75 percent mortality. Biomass consumption and above-ground changes in carbon balances are significant. Crown char is frequently 100 percent from torching fire, and significant branch loss is evident at the highest crown levels. Where crown torching did not occur, char height from ground flames often exceeds 4 meters. Overstory tree effects are generally long lasting. New tree establishment may occur 1-3 years post-fire, but forest development often takes many decades. Herbaceous plants and shrubs are almost completely charred or consumed above ground, often with notable branch loss on taller shrubs, which may be reduced to small stubs. Resprouting from perennial plants, except grasses, is strongly reduced, as most individuals lose viability with a significant reduction in cover.
- Non-Processing Mask - (Value/Code = 6). Areas within the burned area boundary representing missing data due to image sensor problems (Landsat 7 scan line omissions) or atmospheric/terrain interference (clouds, smoke, shadow, snow). No attmepts are made to fill in missing data areas through interpolation or other methods, though MTBS data users may consider this for a given analysis objective.
Are MTBS burn severity data field validated?
Although there is field plot data available for fires, it is not spatially and temporarily comprehensive to the degree needed to support validated thematic burn severity results for all fires across the MTBS data record. The MTBS Program is actively taking steps to utilize the available field plot data where possible to develop and calibrate region-specific burn severity models and validate MTBS burn severity classifications.
Can I customize the burn severity data for my fire(s) of interest?
Yes. For each MTBS fire, the continuous dNBR is provided (or NBR for a single scene assessment). Burn severity class thresholds applied to the dNBR to produce the thematic burn severity classification (dNBR6 or the NBR6 derived from a single scene assessment) are published as part of the metadata. Users may apply their own burn severity thresholds to the dNBR (or NBR) to create a custom thematic burn severity product better calibrated to meet their resource management needs based on their knowledge of the fire, its biophysical setting and/or available field data.
Is field data available for MTBS fires?
No. However, data for thousands of field plots have been collected for numerous fires. The MTBS Program has coordinated with collaborators to compile the available composite burn index (CBI) plot data into a single database for access by users. The data is available through the Burn Severity Portal's CBI page.
Are MTBS burned area boundaries the same as perimeters?
MTBS burn area boundaries are delineated from interpretation of Landsat or Sentinel-2 satellite imagery and continuous burn severity indices (i.e., NBR and dNBR) derived from that imagery. Data and methods used to delineate incident perimeters are highly variable and may be derived from field observation data and/or airborne/satellite imagery at variable resolution and scale. Consequently, MTBS burned area boundaries and incident perimeters may not have complete spatial correspondence. Examples of sources of discrepancies between the two sources of data include, but are not limited to the following:
- MTBS burn area delineations may not include surface burns that are not visible because they occur under unburned vegetation canopies. These areas may or may not be included in incident perimeters depending on availability of field observation information.
- MTBS burn area boundaries do not delineate unburned islands within the fire area whereas incident perimeters typically do, at least for relatively large unburned islands.
- Incident perimeters may be delineated to the extent of fire containment lines. Fires may or may not actually extend to containment lines in some cases resulting in partial over or underestimates of fire area.
How is MTBS burned area boundary acreage calculated?
MTBS mapping acreage is calculated from the burn severity raster datasets. Each pixel intersecting and contained within the burned area boundary is counted. The resulting number is multiplied by 900 square meters, the geographical area of one 30m x 30m data pixel. The result in square meters is then converted to US acres and reported within the burn area boundary shapefile attribute table. This is why the MTBS mapping acreage may not be the same as the acreage resulting from a GIS vector geometry calculation on the burned area boundary.
What are the "stripes" that appear on some MTBS thematic burn severity datasets?
These areas are part of the "Non-processing area" class and are data gaps within a Landsat 7 SLC-off reflectance imagery used in the MTBS fire mapping process for that fire. The Landsat 7 SLC-off product is further described by the Landsat 7 Mission.
I have found an MTBS dataset that has a problem. What do I do?
If you discover an issue with any of the MTBS geospatial datasets, please contact us. In the submitted email, please provide the name of the dataset and a short description of the issue. The MTBS project will evaluate the issue. If it is determined an update to the dataset is necessary, the dataset will be revised and posted to the MTBS website as a revised dataset.
How are MTBS geospatial data provided to users?
MTBS geospatial data are provided at two geographic levels: fire-level and state/national level. The suite of geospatial data compiled for each individually mapped MTBS fire (burned area boundary, continuous burn severity indices, thematic burn severity, etc.) are bundled as a fire-level dataset and provided as a single, compressed archived file. The compressed archive file for each completed MTBS fire can be spatially and temporally queried and downloaded from the Burn Severity Direct Download. These fire level data can also be queried by state and year and downloaded by using the Burn Severity Direct Download web page.
Selected datasets from the suite of fire-level data are appended together by the MTBS project to create seamless national geospatial datasets. MTBS burned area boundary polygons are appended together as a single nationwide ESRI polygon shapefile with pertinent attributes. Additionally, fire occurrence point locations are calculated for each MTBS fire and compiled into a nationwide ESRI point shapefile. Thematic burn severity data for each individual MTBS fire are also mosaicked to generate annual, seamless burn severity GeoTiff images. All three of these national MTBS datasets can be downloaded from the Burn Severity Direct Download webpage.
How do I access MTBS geospatial data for a particular fire?
MTBS fires can be searched using either the Burn Severity Direct Download or the Burn Severity Interactive Viewer tools. These tools allow users to filter fires using one or more criteria to identify specific MTBS fires of interest. Fires meeting the user-designed filtering criteria are listed by their name, size, ignition date, fire type and fire ID with their associated geospatial datasets and mapping/visualization products that can be downloaded individually or in groupings.
What if I just want mapping products for MTBS fires and not the geospatial data?
In addition to the geospatial datasets, the MTBS project provides ready to use mapping and visualization products for each fire. These products include a letter-sized PDF map depicting the burned area boundary superimposed on both a post-fire reflectance image and the thematic burn severity data. A location map, mapping summary and burn severity acreage summary are also included in the map product. A compressed KML is also provided for each MTBS fire that can be used in Google Earth. The KML consists of the pre/post fire satellite imagery, burned area boundary, thematic burn severity data, and relevant fire mapping information. Both products are accessible for download with each full set of MTBS fire level data via either the Burn Severity Interactive Viewer or the Burn Severity Direct Download pages.
What software applications/tools are available to view and use MTBS data?
MTBS data is published in industry standard geospatial formats (GeoTiff, ESRI Shapefiles) and are compatible with most geospatial applications. If you don't have access to an application, there are many opensource applications that are freely available (e.g., QGIS).
Can I analyze MTBS fire data without GIS software?
MTBS data can also be viewed and analyzed as a table in a spreadsheet application like Microsoft Excel. Download the Fire Occurrence Dataset, the Burn Area Boundaries Dataset, or any individual MTBS mapping dataset. You will find a DBF (.dbf) file after unzipping the dataset from its compressed bundle. This file can be dragged into a blank spreadsheet and then be saved as either a csv or xslx file.
How can I easily explore and use MDE data?
The MTBS Data Explorer (MDE) is provided as a convenient and easy to use web-based tool to explore and visualize MTBS burn severity and burned area boundary data. The next best method to easily view and use MTBS data is with the mapping/visualization products we provide as KMZ and PDF files that can be easily used in many applications.
What is the MDE?
The MDE is a web-based application using GEE to provide users the ability to analyze MTBS data outside of a desktop GIS. It allows users to easily explore the entire MTBS burn severity archive and calculate statistical summaries over a user-specified area of interest. Please see the tutorial provided with the MDE for an overview of the application features and how to use them.
Why is the burn severity data in the MDE not the same as what is currently available for download from the MTBS
The MTBS data available for download, behind the available map services and provided in the MDE is all the same. However, those data sources are not all refreshed/updated at the same time with each new MTBS data release. MTBS data for download from the MTBS website are available as soon as a new data release is announced. The MTBS data behind the available map services and the MDE are sourced from different locations. Consequently, the MTBS Program requires additional time and effort to refresh the source data behind these applications after new MTBS data is released. Users of MTBS map services and the MDE should note a potential delay of approximately 2 weeks is possible for the update of the source data after new data is released. Data publication dates are noted on the Burn Severity Direct Download page to inform users of the last source data refresh for MTBS map services and the MDE
I need help understanding MTBS data. Who can I contact?
For technical support regarding how MTBS data are generated, how to access it and is appropriate use, or questions about any other aspect of the MTBS program, please contact us.
Is there training available for understanding and using MTBS data?
Yes. The MTBS Program has prepared a training that provides an overview of the program, fire mapping and assessment protocols, available data products, and how to obtain data and utilize the project website. Additional content is provided in the training to highlight how MTBS data can support resource management decisions. Please see the MTBS Training and Outreach page for more details.
I’m interested in using remote sensing for assessing fire effects and how MTBS utilizes this technology. How can I find out more information?
Technical guidance on Landsat-based remote sensing data processing and analysis, fire severity assessment strategies, and ground based measures of fire effects are documented as part of the FIREMON in the FIREMON Landscape Assessment – Version 5 document. Additional publications and technical documentation on mapping and characterizing burn severity are provided on the MTBS Scientific References webpage.”
What is Landsat?
Landsat is a series of Earth resource satellites jointly managed by NASA and the USGS. The first of nine Landsat missions was launched in 1972 with the latest launch occurring in 2021. The TM sensor on board the Landsat 4 and 5 missions, the ETM+ sensor on board the Landsat 7 mission, and the OLI sensor on board the Landsat 8 and 9 mission, provide continuity in the availability of multispectral imagery at 30-meter resolution since the mid-1980s. This consistent source of imagery is ideal to use for mapping and characterizing MTBS fires at a landscape scale. Additional technical information on Landsat is available from the NASA Landsat Program website and the USGS Landsat Missions website.
What is Sentinel-2?
Sentinel-2 is a constellation of resource satellites managed by the Copernicus, part of the European Space Agency. Currently the constellation consists of two satellites with Sentinel-2A being launched in 2015 followed by Sentinel-2B launching in 2017. Sentinel as provided the MTBS program a similar product for fire characterization while improving the temporal availability of imagery for mapping. Additional technical information on Sentinel-2 is available from the Sentinel-2 Mission Guide website.
Why is Landsat and Sentinel-2 used for mapping MTBS fires?
Landsat TM, Landsat ETM+, Landsat OLI, and with the addition of Sentinel-2 (MSI) data, provide the longest consistent record of relatively high spatial and spectral resolution data for mapping fire severity. Landsat TM/ETM+/OLI and Sentinel-2 MSI data are also cost effective and are available for the entire temporal and geographic extent of the MTBS program.